Visualize Binocular Disparity by Nuke
animationstereoscopy
While you are learning something, the best and mnemonic way to be aware of the details and possible utility behind is try to use different viewpoints on it, try to explain one thing in different languages or images, or even convince someone else the idea. And luckily, you have this “something” all along your life…
The below is just a normal view (the left view) of a cloning project of another autostereoscopic video clip. 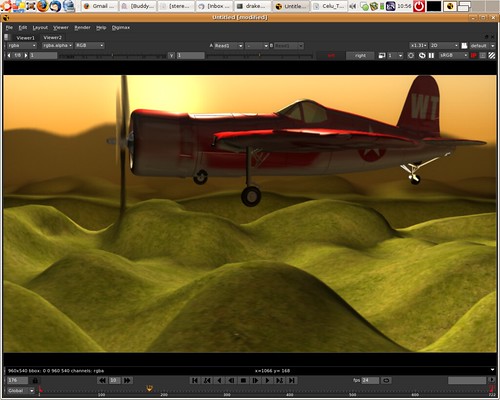
Then, we can make use of Nuke’s Disparity Generator to guess/generate one possible/plausible disparity channels just as below. This is some kind of coloring to make you see the disparity and you can use better way like B&W. But we are not the professional coloring scientific guys and it turns out we just get one cool image without any further intuitive utility. 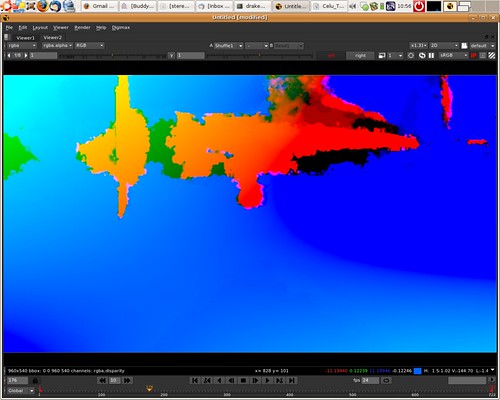
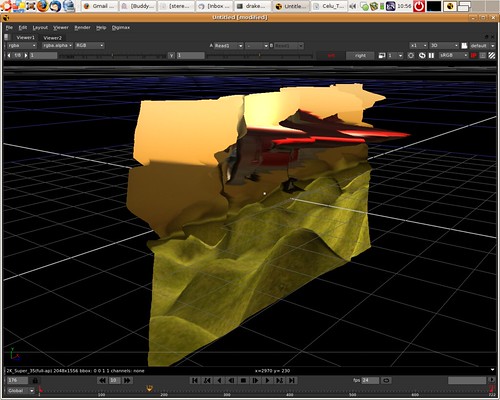
What if we could visualize it in some way? And my favorite image operating tool, Nuke, comes again. 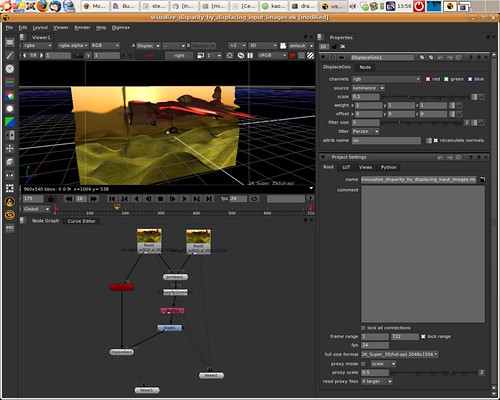
Finally, I got some visualization and realize how bad it is for this generated/guessed disparity channel in this case. I kept learning a lot from this cause this visualization is so straightforward and interactive. 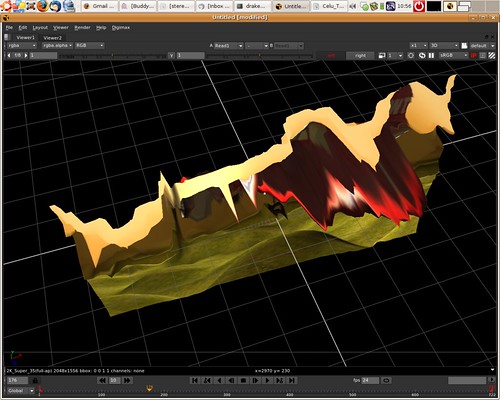
And suddenly, I realize what Rob Cook mentioned in Siggraph 2009, Interactivity should be next trend of Computer Graphics!